Licensed Practical Nurse Salary in Richmond, VA: $67,680 (2026)
Quick Answer:A full-time licensed practical nurse in Richmond, VA earns a median $67,680/year (≈ $32.53/hour) in nominal terms for 2026 — projected from BLS OEWS 2025 (SOC 29-2061). Once you factor in Richmond's price level (2% below national, BEA RPP 97.9), that paycheck buys what $69,161 would nationally. Nominal pay sits 4.3% above the Virginia state average.
Official BLS data · View source
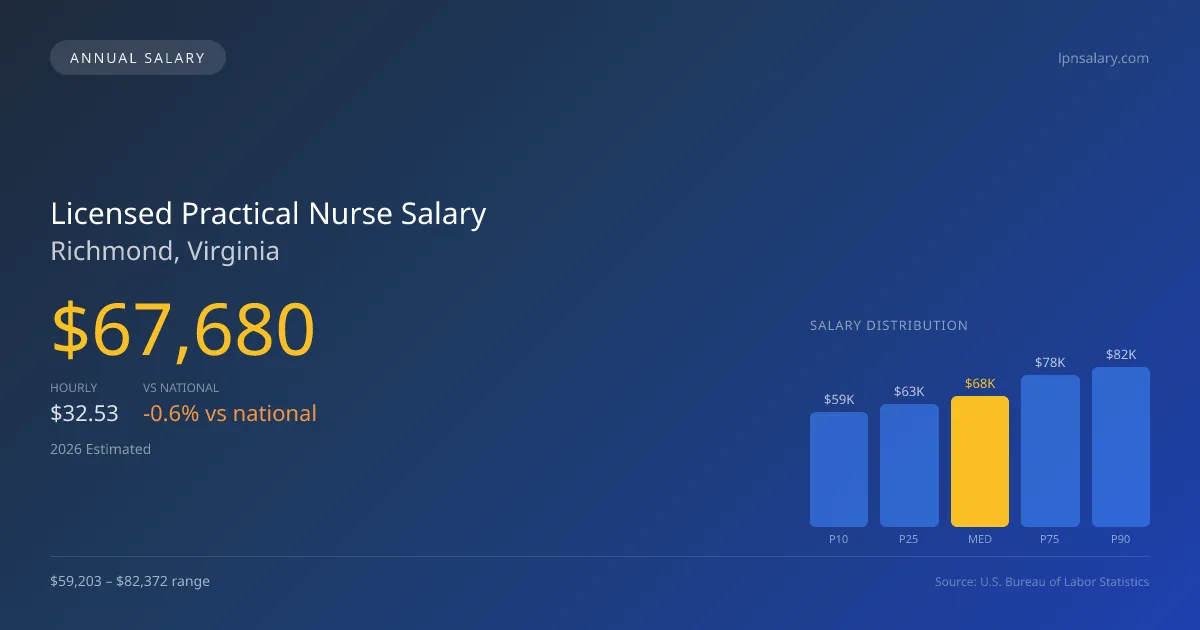
In Richmond, Virginia, licensed practical nurse salaries are projected to reach a median of $67,680 in 2026, slightly lower than the national median of $68,071. The salary range for LPNs in the area ranges from $59,203 at the 10th percentile to $82,372 at the 90th percentile. These estimates, derived from 2025 Bureau of Labor Statistics (BLS) data, reflect the local scope of practice, which includes responsibilities such as IV therapy and patient assessment. Factors such as these can directly influence compensation levels in Richmond's job market, where the demand for skilled LPNs remains robust as healthcare facilities seek to meet the needs of a growing population.
Salary Breakdown
| Percentile | Annual | Hourly |
|---|---|---|
| Entry Level (P10) | $59,203 | $28.47 |
| Lower Range (P25) | $63,103 | $30.34 |
| Median (P50)(typical) | $67,680 | $32.53 |
| Upper Range (P75) | $78,112 | $37.56 |
| Top Earners (P90) | $82,372 | $39.61 |
Median Salary Position
0.57% below the national average
2026 Salary Percentile Distribution in Richmond
In Richmond, VA, the licensed practical nurse salary spread from the 10th to 90th percentile is $23,169 (2026 est.). At $67,680, the local median is 0.57% below the national median of $68,071.
Salary Calculator
At 40 hours/week in Richmond: You'd be in the lower-middle range
How Richmond Licensed Practical Nurse Pay Compares
Richmond median: $67,680/year (2026)
| Compared To | Median Salary | Richmond Pays |
|---|---|---|
| Virginia Average | $64,889 | +4.30% more |
| National Average | $68,071 | -0.57% less |
Licensed Practical Nurses in Richmond, VA earn a median of $67,680 per year (2026 est.), which is 0.57% lower than the national median of $68,071 and 4.30% above the Virginia state average of $64,889.
Cost-of-Living Adjusted Salary
Richmond has a cost of living 2.14% below the national average, meaning your salary goes further here.
Adjusted salary = nominal × (100 / CoL index). CoL index: 100 = national average.
Richmond, VA has a cost-of-living index of 97.858 (below the national average of 100). A licensed practical nurse earning $67,680 nominally has purchasing power equivalent to $69,161 in an average-cost city — an effective 2.19% boost.
Compare Purchasing Power
Select a city to see how your salary compares after cost of living
Select a city above to compare purchasing power
2019 BLS Actual
$46,020
2025 BLS Actual
$64,030
2026 Current Est.
$67,680
2019–2027 Growth
+55.4%
Salary Trajectory for Licensed Practical Nurses in Richmond (2019–2027)
2019–2025: actual BLS OEWS data for this metro area. 2026+: CAGR 5.70% projection.
| Year | Annual Salary | Status |
|---|---|---|
| 2019 | $46,020 | Actual |
| 2020 | $49,150 | Actual |
| 2021 | $48,300 | Actual |
| 2022 | $52,520 | Actual |
| 2023 | $58,700 | Actual |
| 2024 | $62,590 | Actual |
| 2025 | $64,030 | Actual |
| 2026(current) | $67,680 | Estimated |
| 2027 | $71,537 | Projected |
Based on 7 years of BLS OEWS data for the Richmond metropolitan area, the median licensed practical nurse salary grew 39.1% from $46,020 (2019) to $64,030 (2025). At a 5.70% compound annual growth rate, salaries are projected to reach $71,537 by 2027 — a total increase of $25,517 (55.45%) from 2019.
Note: Historical values (2019–2025) are actual BLS OEWS figures for the Richmond metropolitan area, sourced from annual Occupational Employment and Wage Statistics surveys. 2026–2026 figures are current estimates, and 2027 values are projections, calculated using a 5.70% CAGR derived from 7-year BLS historical data. Actual salaries may vary based on employer, experience, certifications, and local market conditions.
Salary by Experience Level
| Experience | Estimated Salary Range |
|---|---|
| 0-2 years (New Graduate) | $59,203 – $63,103 |
| 3-5 years (Mid Career) | $63,103 – $67,680 |
| 5+ years (Experienced) | $67,680 – $78,112 |
| 10+ years (Top Earner) | $78,112 – $82,372 |
LPN salary ranges estimated from BLS percentile data. Individual licensed practical nurse compensation varies by employer, certifications, and specialization.
Licensed Practical Nurse Job Market in Richmond
Currently, Richmond employs approximately 2,570 licensed practical nurses, contributing significantly to the local healthcare workforce. The cost of living index in the area stands at 97.858, indicating that while salaries are competitive, purchasing power may vary for LPNs based on the cost of living. Among local employers, skilled nursing facilities typically offer the highest pay, followed by hospitals and long-term care settings. Factors driving the disparity in earnings include the type of facility, shift differentials, and additional certifications such as IV therapy. For those looking to maximize their earnings, targeting positions in skilled nursing, obtaining relevant certifications, and considering shift work can provide significant advantages in the Richmond VA market.
More salary data for Richmond, VA:
Frequently Asked Questions
How much do licensed practical nurses make in Richmond, VA in 2026?
Is Richmond, VA a good place to work as a licensed practical nurse?
Can licensed practical nurses make $100K in Richmond?
What is the cost-of-living adjusted licensed practical nurse salary in Richmond?
How much does a licensed practical nurse make per hour in Richmond?
Related Pages
Compare Salaries
Career Resources
Nearby Cities in Virginia
Written by Aisha Malik, LPN
Career Analyst
Aisha has 10 years of experience as a licensed practical nurse. She specializes in pediatric nursing. Aisha has worked in various outpatient clinics.
Methodology & Data Source
Salary figures on this page are 2026 projections based on the Bureau of Labor Statistics Occupational Employment and Wage Statistics (OEWS) survey, May 2026 release. The BLS reported a median annual salary of $64,030 for licensed practical nursesin the Richmond metropolitan area. A 5.70% compound annual growth rate (CAGR), calculated from 6-year national BLS wage trends, was applied to project current 2026 compensation. Percentile ranges (P10–P90) represent the full salary distribution across experience levels and practice settings in this market.
Data Sources & Methodology
Source: BLS, OEWS, 7-year dataset (–). Per-city data from annual BLS metropolitan area surveys.
2026 figures are projected from 2025 BLS data using a compound annual growth rate (CAGR) of 5.70%, derived from historical BLS wage trends for licensed practical nurses (SOC 29-2061).
Compiled and verified by Aisha Malik, LPN, a licensed licensed practical nurse with 10+ years of clinical experience. · View source data at BLS.gov