Licensed Practical Nurse Salary in Lynchburg, VA: $64,868 (2026)
Quick Answer:A full-time licensed practical nurse in Lynchburg, VA earns a median $64,868/year (≈ $31.18/hour) in nominal terms for 2026 — projected from BLS OEWS 2025 (SOC 29-2061). Once you factor in Lynchburg's price level (11% below national, BEA RPP 89.4), that paycheck buys what $72,589 would nationally. Nominal pay sits 0.0% above the Virginia state average.
Official BLS data · View source
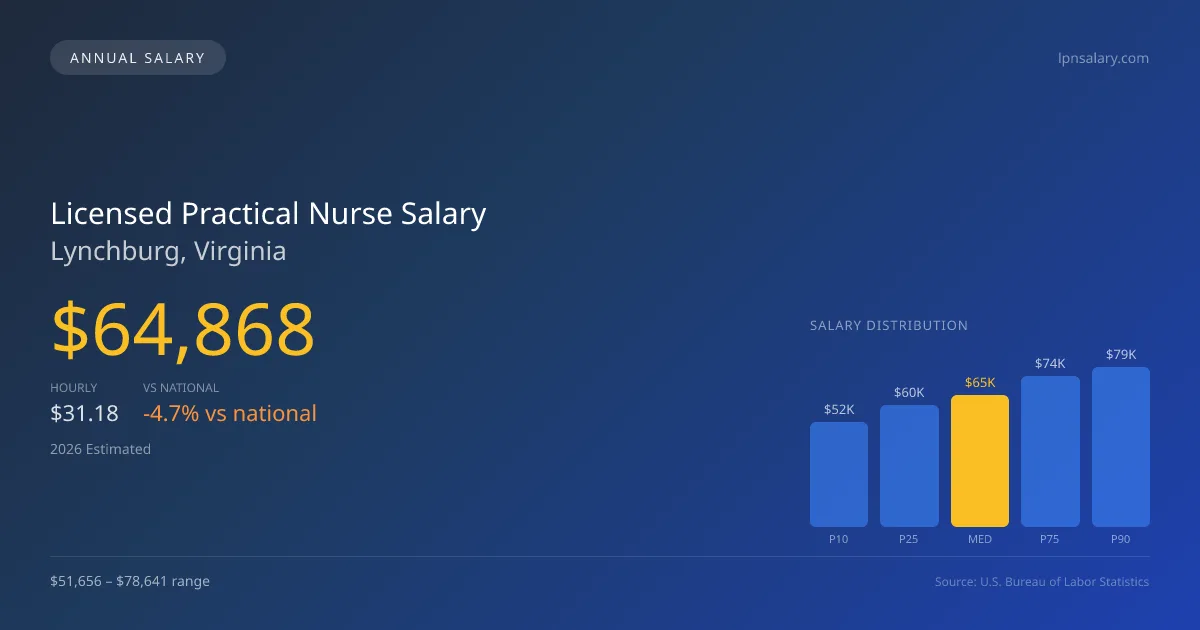
In Lynchburg, Virginia, licensed practical nurses can expect a median annual salary of $64,868 in 2026, which is slightly below the national median of $68,071. The salary range for LPNs in the area spans from $51,656 at the 10th percentile to $78,641 at the 90th percentile, reflecting the diverse opportunities available in different healthcare settings. This data, derived from 2025 BLS OEWS surveys, is significant in understanding local compensation levels, particularly in light of Virginia's scope-of-practice rules that allow LPNs to perform IV therapy and comprehensive patient assessments. The competitive nature of the local healthcare market suggests that numerous facilities are seeking qualified LPNs, contributing to a promising job environment.
Salary Breakdown
| Percentile | Annual | Hourly |
|---|---|---|
| Entry Level (P10) | $51,656 | $24.83 |
| Lower Range (P25) | $60,112 | $28.90 |
| Median (P50)(typical) | $64,868 | $31.18 |
| Upper Range (P75) | $74,360 | $35.75 |
| Top Earners (P90) | $78,641 | $37.81 |
Median Salary Position
4.71% below the national average
2026 Salary Percentile Distribution in Lynchburg
In Lynchburg, VA, the licensed practical nurse salary spread from the 10th to 90th percentile is $26,985 (2026 est.). At $64,868, the local median is 4.71% below the national median of $68,071.
Salary Calculator
At 40 hours/week in Lynchburg: You'd be in the lower-middle range
How Lynchburg Licensed Practical Nurse Pay Compares
Lynchburg median: $64,868/year (2026)
| Compared To | Median Salary | Lynchburg Pays |
|---|---|---|
| National Average | $68,071 | -4.71% less |
Licensed Practical Nurses in Lynchburg, VA earn a median of $64,868 per year (2026 est.), which is 4.71% lower than the national median of $68,071.
Cost-of-Living Adjusted Salary
Lynchburg has a cost of living 10.64% below the national average, meaning your salary goes further here.
Adjusted salary = nominal × (100 / CoL index). CoL index: 100 = national average.
Lynchburg, VA has a cost-of-living index of 89.363 (below the national average of 100). A licensed practical nurse earning $64,868 nominally has purchasing power equivalent to $72,589 in an average-cost city — an effective 11.9% boost.
Compare Purchasing Power
Select a city to see how your salary compares after cost of living
Select a city above to compare purchasing power
2019 BLS Actual
$42,430
2025 BLS Actual
$61,370
2026 Current Est.
$64,868
2019–2027 Growth
+61.6%
Salary Trajectory for Licensed Practical Nurses in Lynchburg (2019–2027)
2019–2025: actual BLS OEWS data for this metro area. 2026+: CAGR 5.70% projection.
| Year | Annual Salary | Status |
|---|---|---|
| 2019 | $42,430 | Actual |
| 2020 | $42,570 | Actual |
| 2021 | $45,710 | Actual |
| 2022 | $48,600 | Actual |
| 2023 | $52,300 | Actual |
| 2024 | $58,360 | Actual |
| 2025 | $61,370 | Actual |
| 2026(current) | $64,868 | Estimated |
| 2027 | $68,566 | Projected |
Based on 7 years of BLS OEWS data for the Lynchburg metropolitan area, the median licensed practical nurse salary grew 44.6% from $42,430 (2019) to $61,370 (2025). At a 5.70% compound annual growth rate, salaries are projected to reach $68,566 by 2027 — a total increase of $26,136 (61.60%) from 2019.
Note: Historical values (2019–2025) are actual BLS OEWS figures for the Lynchburg metropolitan area, sourced from annual Occupational Employment and Wage Statistics surveys. 2026–2026 figures are current estimates, and 2027 values are projections, calculated using a 5.70% CAGR derived from 7-year BLS historical data. Actual salaries may vary based on employer, experience, certifications, and local market conditions.
Salary by Experience Level
| Experience | Estimated Salary Range |
|---|---|
| 0-2 years (New Graduate) | $51,656 – $60,112 |
| 3-5 years (Mid Career) | $60,112 – $64,868 |
| 5+ years (Experienced) | $64,868 – $74,360 |
| 10+ years (Top Earner) | $74,360 – $78,641 |
LPN salary ranges estimated from BLS percentile data. Individual licensed practical nurse compensation varies by employer, certifications, and specialization.
Licensed Practical Nurse Job Market in Lynchburg
Examining the local job market, Lynchburg employs around 570 licensed practical nurses, offering a variety of employment settings from skilled nursing facilities to physician offices. With a cost-of-living index of 89.363, LPNs in the area enjoy better purchasing power in relation to their salaries compared to national averages. Facilities such as long-term care and skilled nursing facilities tend to offer the highest compensation, often supplemented by incentives such as shift differentials, IV therapy stipends, and pay premiums for weekend and holiday shifts. To maximize earning potential, LPNs should consider pursuing additional certifications, seeking employment in higher-paying settings, or exploring LPN-to-RN bridge programs for elevated responsibility and pay. Understanding these dynamics helps clarify how much licensed practical nurses make in Lynchburg, VA, and guides career advancement strategies.
More salary data for Lynchburg, VA:
Frequently Asked Questions
How much do licensed practical nurses make in Lynchburg, VA in 2026?
Is Lynchburg, VA a good place to work as a licensed practical nurse?
Can licensed practical nurses make $100K in Lynchburg?
What is the cost-of-living adjusted licensed practical nurse salary in Lynchburg?
How much does a licensed practical nurse make per hour in Lynchburg?
Related Pages
Compare Salaries
Career Resources
Nearby Cities in Virginia
Written by Aisha Malik, LPN
Career Analyst
Aisha has 10 years of experience as a licensed practical nurse. She specializes in pediatric nursing. Aisha has worked in various outpatient clinics.
Methodology & Data Source
Salary figures on this page are 2026 projections based on the Bureau of Labor Statistics Occupational Employment and Wage Statistics (OEWS) survey, May 2026 release. The BLS reported a median annual salary of $61,370 for licensed practical nursesin the Lynchburg metropolitan area. A 5.70% compound annual growth rate (CAGR), calculated from 6-year national BLS wage trends, was applied to project current 2026 compensation. Percentile ranges (P10–P90) represent the full salary distribution across experience levels and practice settings in this market.
Data Sources & Methodology
Source: BLS, OEWS, 7-year dataset (–). Per-city data from annual BLS metropolitan area surveys.
2026 figures are projected from 2025 BLS data using a compound annual growth rate (CAGR) of 5.70%, derived from historical BLS wage trends for licensed practical nurses (SOC 29-2061).
Compiled and verified by Aisha Malik, LPN, a licensed licensed practical nurse with 10+ years of clinical experience. · View source data at BLS.gov